AcademicMay 24, 2024
Intro To Data Science
A Jupyter Notebook analysis of health data using descriptive statistics, outlier handling, and visualization.
- Jupyter Notebook
- Data Science
- Statistics
- Python
- Jupyter
- pandas
- Matplotlib
- NumPy
Overview
This project is a notebook-based investigation of a health dataset with 2,000 records and 11 columns. The columns include age, income, stress level, weekly exercise, cholesterol, weight, height, blood pressure, gender, education, and health status.
The notebook loads the CSV into pandas and separates numeric measurements from categorical values. For numeric columns it calculates measures such as mean, median, spread, quartiles, skewness, and kurtosis. For categorical columns it reports distinct values, frequencies, and proportions.
Analysis workflow
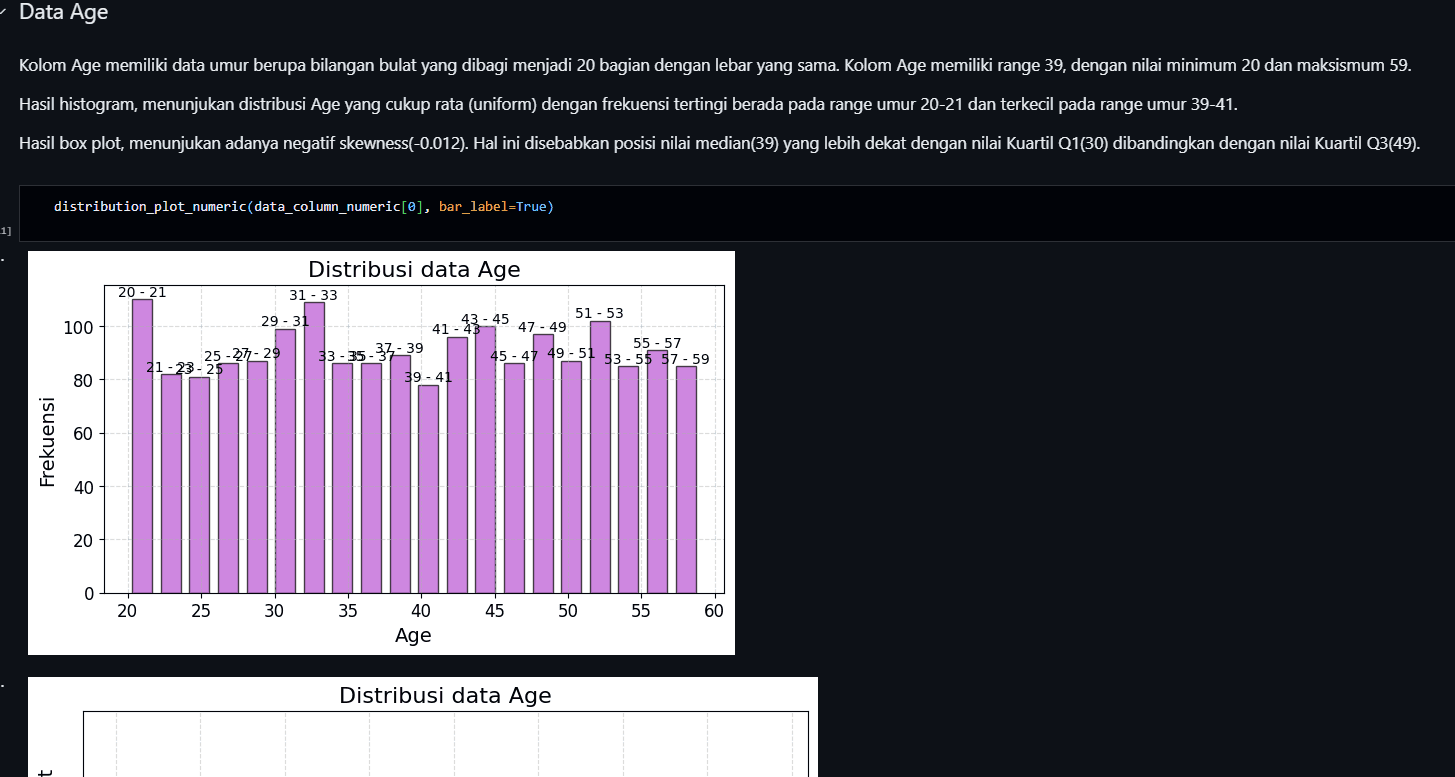
The exercises compare built-in statistical operations with calculations written out directly, making it possible to check how each summary is derived. The notebook also applies the interquartile-range rule to identify and remove numeric outliers, then continues the analysis on the resulting data. Visualizations help communicate patterns in the measurements and categories.
data = pd.read_csv("health.csv", index_col=0)
data.info()
The workflow keeps the data loading, calculations, and outputs together in a reproducible notebook. Because filtering changes the rows under analysis, the project also illustrates why outlier handling is an analytical decision rather than a neutral cleanup step.
What I learned
Working through the dataset helped me practice choosing statistics that fit numeric versus categorical data and validating library results against manual calculations. It also provided a first experience combining data preparation, descriptive analysis, statistical reasoning, and visual communication in Python.